I’ve been battling with a few of WCF’s "endearing" foibles over the last couple of days (like this one). One thing that I really should have noticed earlier to help with this battle is that you can enable tracing for WCF. MSDN gives this example:
<configuration>
   <system.diagnostics>
      <sources>
            <source name="System.ServiceModel"
                    switchValue="Information, ActivityTracing"
                    propagateActivity="true">
            <listeners>
               <add name="traceListener"
                   type="System.Diagnostics.XmlWriterTraceListener"
                   initializeData= "c:\log\Traces.svclog" />
            </listeners>
         </source>
      </sources>
   </system.diagnostics>
</configuration>
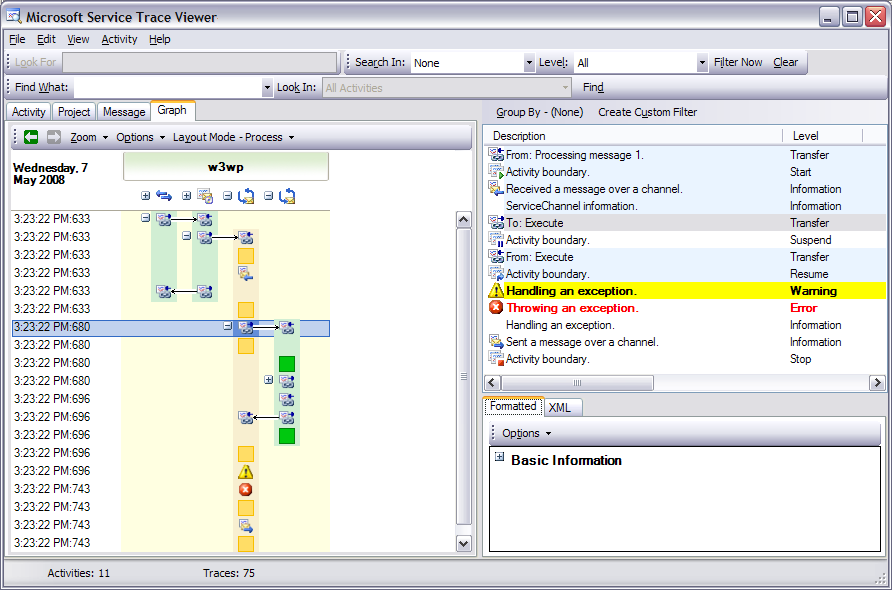
This produces a fairly unreadable mess, but you can use the Service Tracer Viewer (SvcTraceViewer.exe) that comes with the Windows SDK (C:\Program Files\Microsoft SDKs\Windows\v6.0A\Bin on my PC) to get some useful information out of it. This is actually quite a cool tool, providing a nice interface to view all the different activities happening behind the scenes, and highlighting errors that occur.